AirDNA, as the name suggests is an analytics platform providing unmatched global Airbnb data and insights with cutting edge technology to help short term rental owners make wiser decisions around the world.
They recently added HomeAway data into the platform, allowing you to see the breakdown of HomeAway and Airbnb properties in any market worldwide.
If you are looking to buy a new property to rent on Airbnb/HomeAway/VRBO – it is a good idea to know the numbers before making the investment.
You can get a fair idea by looking at a bunch of different properties available online in the area you are interested in.
See what they are charging per night, what is the cleaning and how much of their Airbnb calendar is booked.
This gives you a fair bit of idea about how the market might be like in that region.
…but if its a significant investment, you wouldn’t want to make a decision by looking at a few properties.
AirDNA gives you well organised meaningful holiday rental data of an area, reports are full of facts so you can make a well-educated decision not just to buy the property but also learn other aspects in that area such as:
AirDNA gathers its information from Airbnb, HomeAway & VRBO public website using data scraping methods.
It regularly crawls the properties available on the Airbnb website and tracks the performance of listings around the globe each day.
Crawling generates raw data which is then analyzed and presented to users in useful reports in AirDNA Market Minder tool, its an interactive market intelligence tool.
Market Minder data is updated monthly in the first week (between 5th and 8th) for the previous month’s data.
3. How much does AirDNA cost?
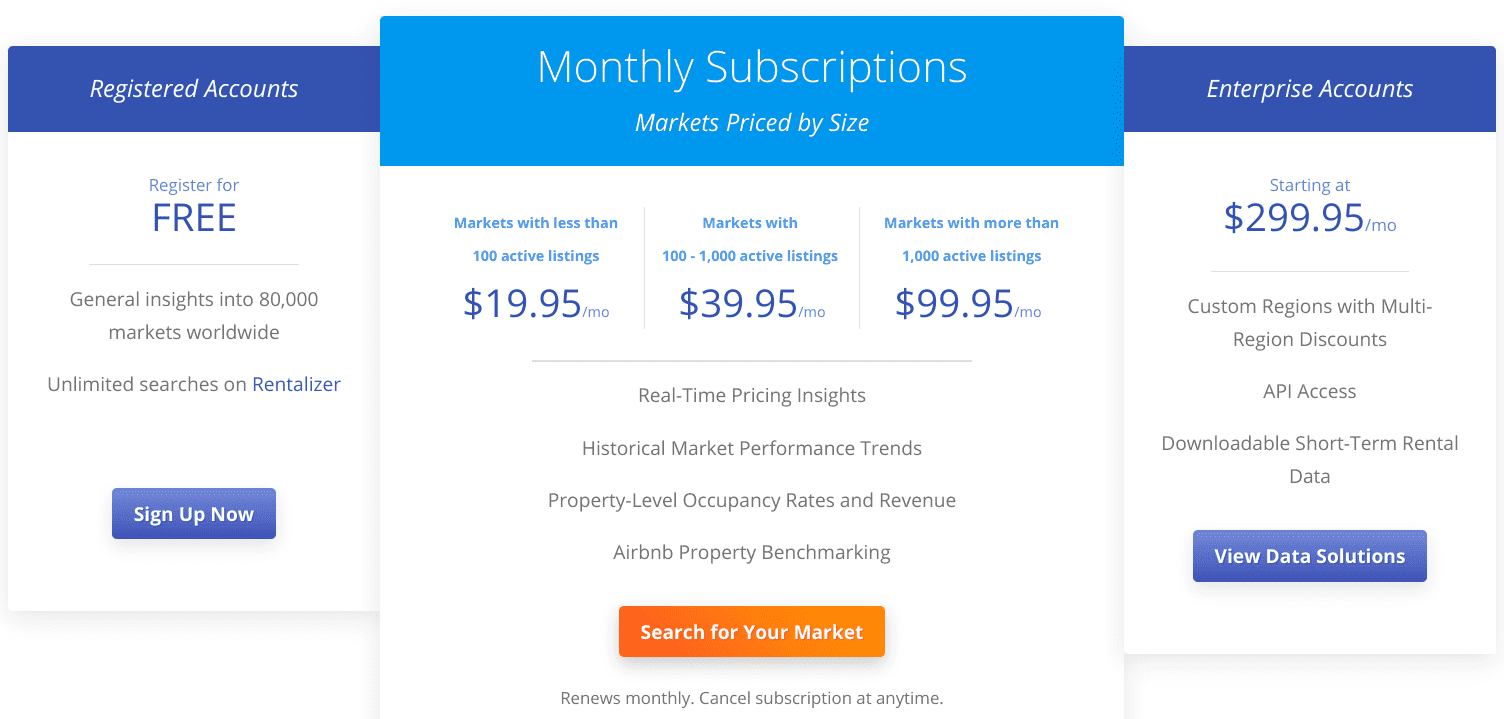
AirDNA is a monthly subscription service and you can cancel at any time.
It broadly works on three pricing models.
An area with >1,000 active listings: If the area you choose has more than 1,000 active listings (usually Citywide reports) it will cost you USD 99.95/month
An area with more than 100-1,000 active listings: If the area you choose has between 100-1,000 active listings (Usually neighbourhood reports) it will cost you USD 99.95/month
An area with <100 listings: If the area you choose has less than 100 active listings (usually postcode or street specific reports) it will cost you USD 19.95/month
AirDNA Pricing Model
4. What kind of data reports do you get?
AirDNA offers two products:
1. AirDNA Market Minder
You are most likely to use only this AirDNA module as it gives statistics of local Airbnb and HomeAway/VRBO markets across the world.
It has interactive maps you to let you explore the performance of specific neighbourhoods and even individual vacation rental properties in over 80,000 cities worldwide.
It has over 25 critical matrices for you to consume, such as:
Average Daily Rate
RevPAR
Occupancy
Active Listing
Rental Revenue
Booking Lead Times
2. AirDNA Investment Explorer
If you are an investor looking to invest in the US, AirDNA Investment Explorer is what you need.
5. What's in AirDNA Market Minder?
AirDNA Market Minder gives you a multi-dimensional view of the local market, it provides about 25 details reports, some of the key reports are:
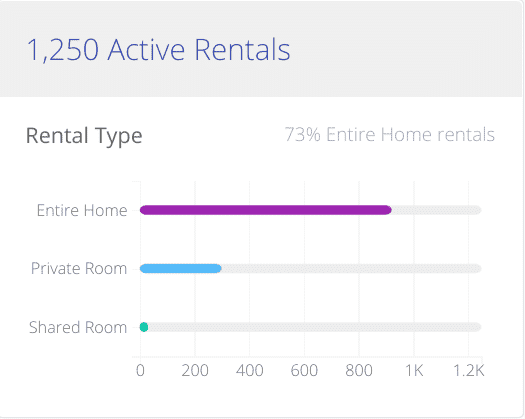
a. Active Rentals
This report tells you how many active rentals are in an area with a breakdown of:
Entire Properties
Private Room
Shared Room
Remember, this report is updated once every month based on the figures AirDNA recorded in the previous month.
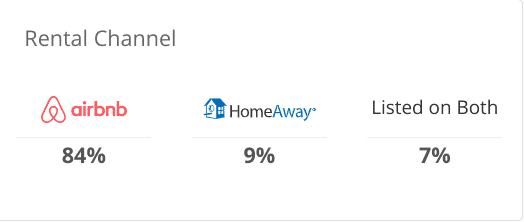
b. Rental Channel
This report shows how many properties are listed on each channel.
Note: AirDNA provided data only for Airbnb and HomeAway.
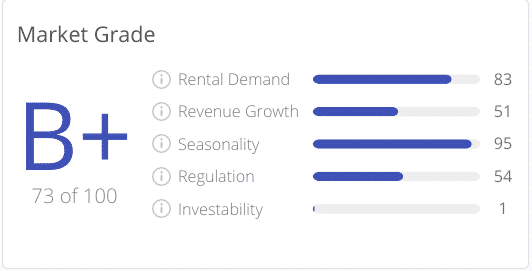
c. Market Grade
Market Grade is calculated by comparing the performance of that market Vs top 2000 global Airbnb markets.
It includes five parameters.
Rental Demand
How often are rentals booked throughout the year? By using a combination of annual occupancy and listing growth rates, this metric shows the relative travel demand in this market.
High Score = High Travel Demand
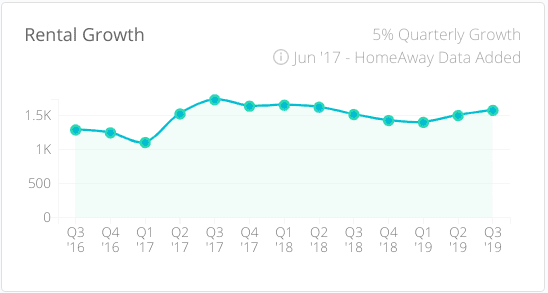
Revenue Growth
Did properties earn more this month than they did in the same month last year? This is calculated by looking at the change in year-over-year RevPAR for properties that received bookings in both time periods.
High Score = Increasing Revenue per Property
Seasonality
How much does travel demand differ between peak season and low season? This is the percentage difference between the minimum and maximum monthly RevPAR in the past year.
High score = Low seasonality
Regulation
An algorithm that looks at host and property behaviour to identify signs of regulation.
High score = Low regulation
Investability
Is this a good city for a short-term rental investment property? Compares the cost of homes in the city to the average short-term rental income of full-time rental properties.
High Score = Good Investment Opportunity
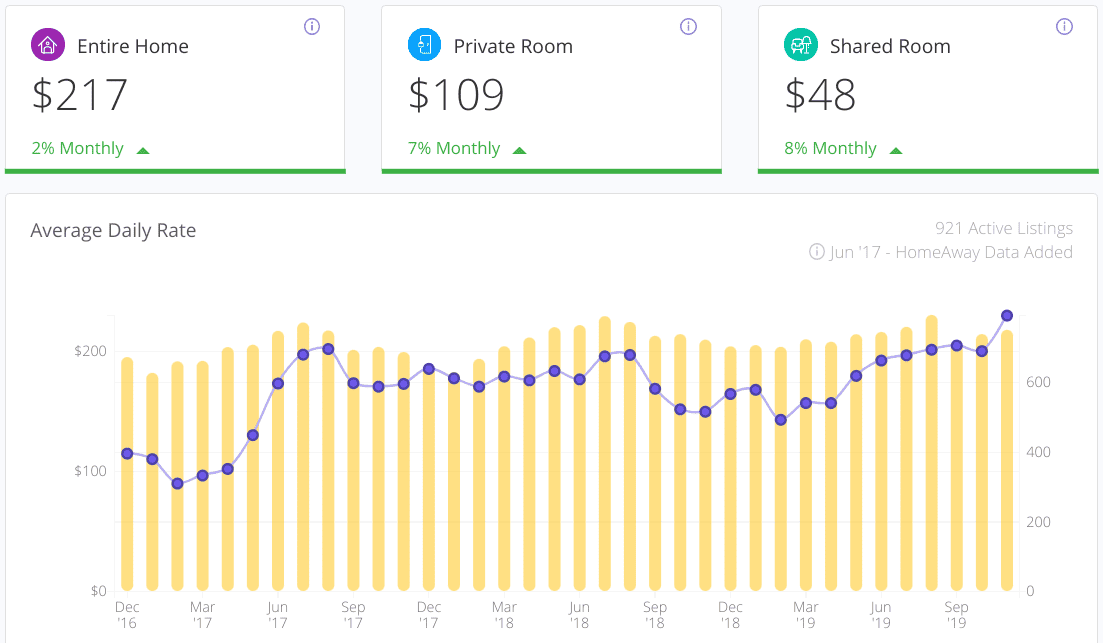
d. Average Daily Rate
Average daily rate (ADR) is the average booked night rate + Airbnb cleaning fee for all booked days over the previous year.
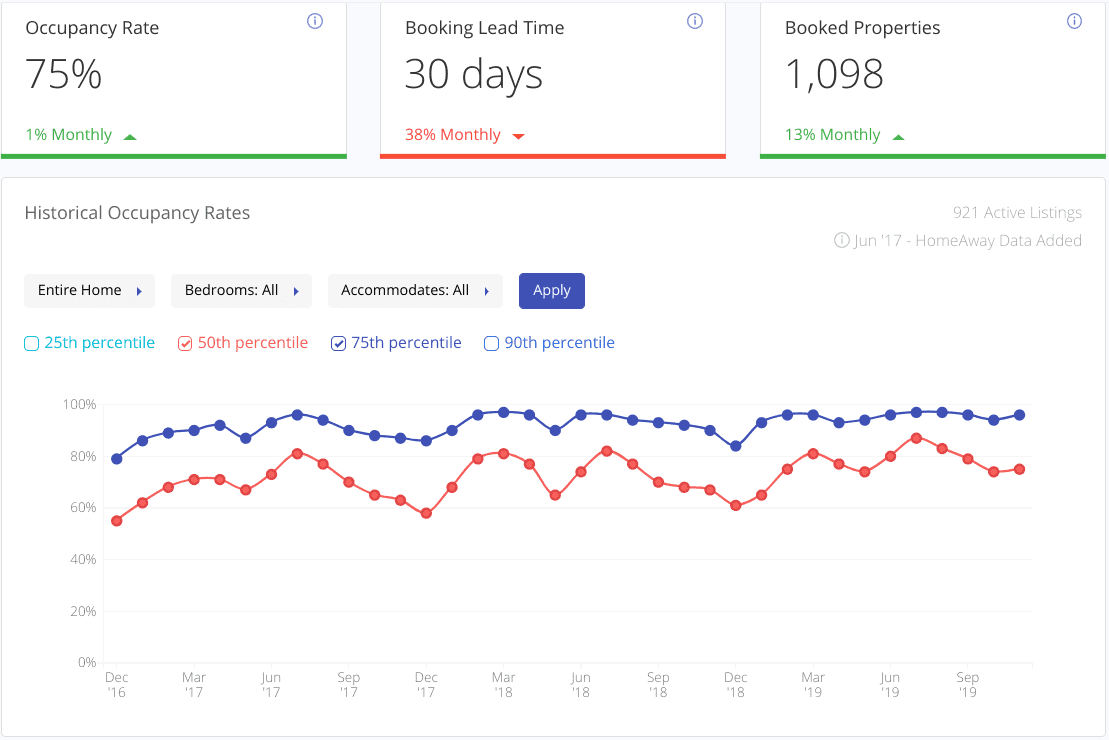
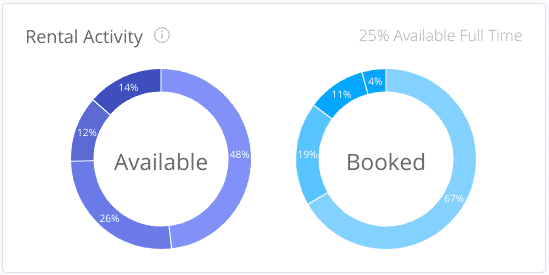
e. Occupancy Rate
The number of booked days divided by the total number of days available for rent in the last month. Properties with no reservation are excluded.
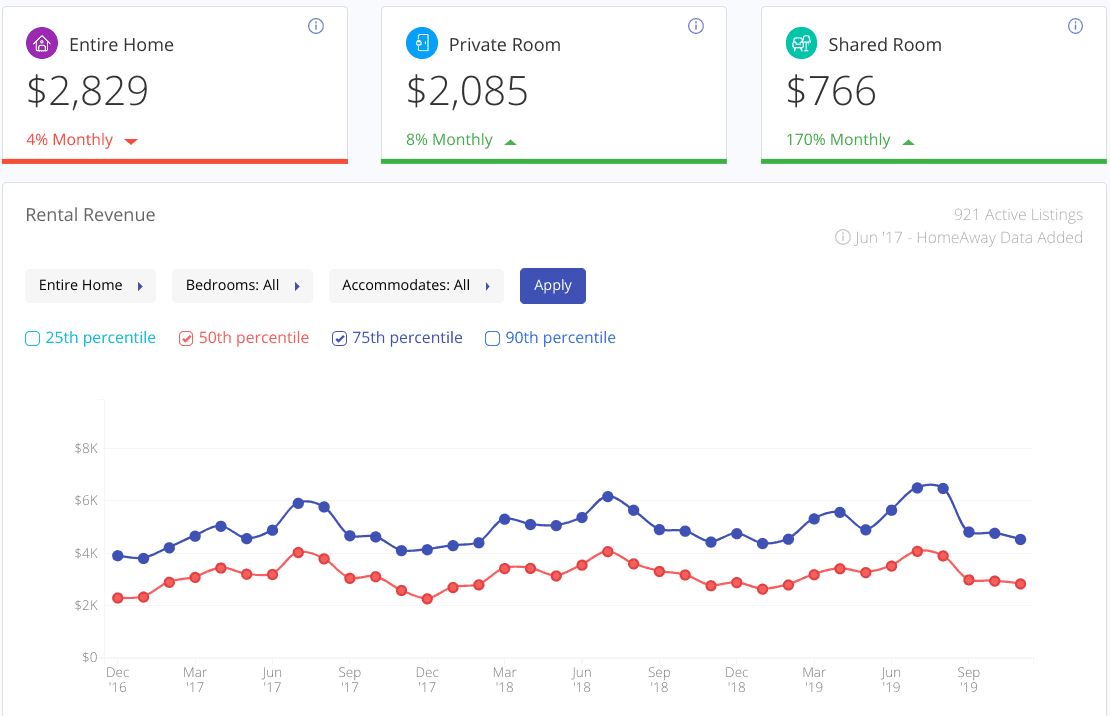
f. Revenue
The medial monthly revenue (total nightly rate + cleaning fees) generated by all home listings with at least one booked day in the previous month.
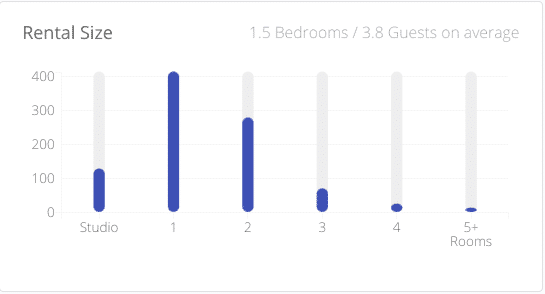
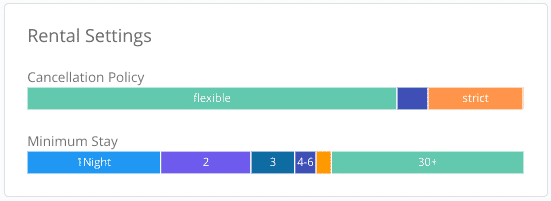
g. Rental Size
This shows the size of rental properties in your area.
Some rentals are only available for rent during a single weekend, while others are full-time investment properties. This chart segments all active properties by the number of days they were available for rent and actually rented over the past year.


")